Bargaining primer: AU’s financial situation
Collective bargaining between AUFA and AU is set to commence this spring with opening proposals to be exchanged next week. Looking at bargaining that is occurring at other PSEs around Alberta, there appears to be a pattern to employers’ opening offers:
Four-year deals with cost-of-living adjustments (COLAs) of -4%, 0%, 0%, and 0%.
Language rollbacks, including harsher disciplinary procedures and weaker layoff protections.
We expect this pattern reflects a provincial mandate. Back in November 2020, the government gave itself the power to impose secret and binding mandates on PSE Boards. Consequently, we expect AU’s opening offer to be in this zone.
A perennial employer argument is that AU cannot afford a salary increase and, indeed, requires pay reductions to stay afloat. During some rounds of bargaining, there has been an explicit threat of layoffs if AUFA does not agree. In other rounds, the implication is left for us to imagine.
Knowing this, it is useful to have a peek at AU’s finances to see if any of these arguments could be considered reasonably true. The following information is taken from AU’s annual reports. You can read the most recent annual report (2019/20) here.
BIG PICTURE
It is best to start by understanding where AU’s revenue comes from. The biggest source of revenue is student tuition (52%). Government grants are the second largest source at 33%.
An important implication of this distribution of revenue is that, while government grants are declining under the UCP, these declines have less of an impact on AU than they do on other PSEs (which are more reliant on government grants and thus hit harder by percentage reductions in their grants). In 2020/21, AU was also hit with a smaller percentage reduction in grants (-1%) than other PSEs (e.g., U of A got a -9% while U of C and U of L got -6%).
Next, it is useful to look at AU’s total revenue and expenses over time.
Revenue and Expenses, 2012/13-2019/20 ($m).
| Year | Revenue | Expense | Annual Operating Surplus | Accumulated Operating Surpluses |
|---|---|---|---|---|
| 2012/13 | 132.5 | 131.8 | 0.8 | 0.8 |
| 2013/14 | 130.4 | 126.7 | 3.6 | 4.4 |
| 2014/15 | 131.0 | 128.5 | 2.5 | 6.9 |
| 2015/16 | 132.6 | 133.2 | -0.6 | 6.3 |
| 2016/17 | 137.4 | 133.8 | 3.8 | 10.1 |
| 2017/18 | 139.3 | 132.3 | 7.2 | 17.3 |
| 2018/19 | 148.5 | 134.2 | 14.3 | 31.6 |
| 2019/20 | 150.7 | 147.7 | 3.0 | 34.9 |
| Change % | +13.7% | +12.1% |
The upshot is that AU’s financial health is strong. Two things of note are:
Over the last 8 years, AU has generated an annual operating surplus 7 times and has accumulated almost $35m in surpluses. Consequently, the threat of insolvency within two years asserted by former AU President Peter MacKinnon in 2015 was not actually real and is best seen as a bargaining scare tactic by the employer.
AU’s revenue and expenses rise more or less in lock step. This reflects, in part, that the biggest source of revenue (tuition) is, more or less, proportional to the largest source of expense (teaching and student support). Basically, rising enrollments mean more cash, while also triggering more costs.
LOOKING FORWARD
We don’t know what this year’s (2020/21) financial statements will look like. The fiscal year does not end until March 31 and annual reports tend to appear in the summer or later. That said, we can make some educated guesses.
In 2020/21, AU saw:
A reduction in government grants of -1%, totalling -$0.5m.
An increase in enrollment of almost 10%.
An increase in tuition costs of about 5%, probably around +$4.0m.
Factoring in some inflation, the likely effect in 2020/21, in keeping with the historical pattern, will be a modest surplus.
Looking ahead to next year (2021/22), AU will be seeing a further 5% increase in tuition revenue. Some of this increase will be offset by a further reduction in government grants and the potential for some of AU’s grant to be conditioned on performance measure outcomes.
Some faculty councils were told that, for 2021/22, AU initially budgeted for a 10% reduction in government funding. AU only got a 1% reduction, meaning that there is already a $3.5m surplus for this coming year. The upshot is that AU will likely remain in reasonable financial health in the near future and there is no financial rationale for AU not providing a cost-of-living adjustment.
WHERE DOES THE MONEY GO?
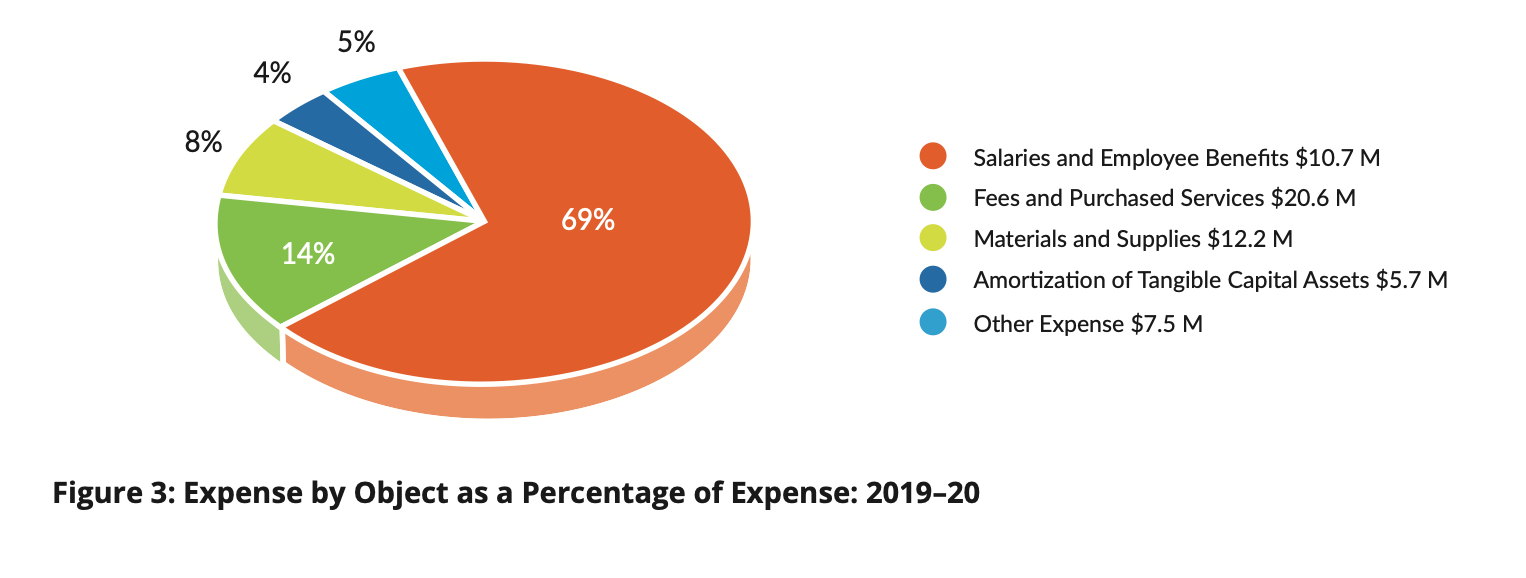
One of the arguments often advanced to support wage rollbacks is that most public sector spending is, in fact, on public-sector workers and (somehow) this is unsustainable. The figure below shows AU’s expenses by object and, indeed, the largest category of expenses at AU is salaries and compensation (69.9%).
Note: There is a slight error in the figure (taken from the annual report). The value of salaries and employee benefits is $101.7m, not $10.7m.
This distribution of expenses is not surprising. Almost all post-secondary institutions spend the majority of their funding on salaries (e.g., U of L spent 66% on this item in 2019/20). This reflects that education is a hands-on activity that requires lots of workers.
The argument that salaries comprising such a large portion of expenses is somehow unsustainable is difficult to fathom. These salaries are necessary to generate revenue (i.e., tuition) because workers are a necessary part of teaching and student support.
NEXT STEPS
Once AUFA and AU exchange proposals, the AUFA bargaining team will present both proposals (with analysis) to AUFA members. The bargaining team will then begin the difficult and likely protracted process of negotiating a mutually acceptable agreement.
Bob Barnetson, Chair
Job Action Committee


